
Summary & Quick Fact
- 87 percent of drivers have engaged in at least one risky driving behavior incident within the past month.
- Drivers age 17 and under are some of the most cautious drivers compared to the other age groups.
- While women tended to use their phone more and men were more aggressive, data shows there is no significant difference in the gender divide with driver behavior.
- More than age and gender, location seems to be the factor most indicative of bad behavior behind the wheel.
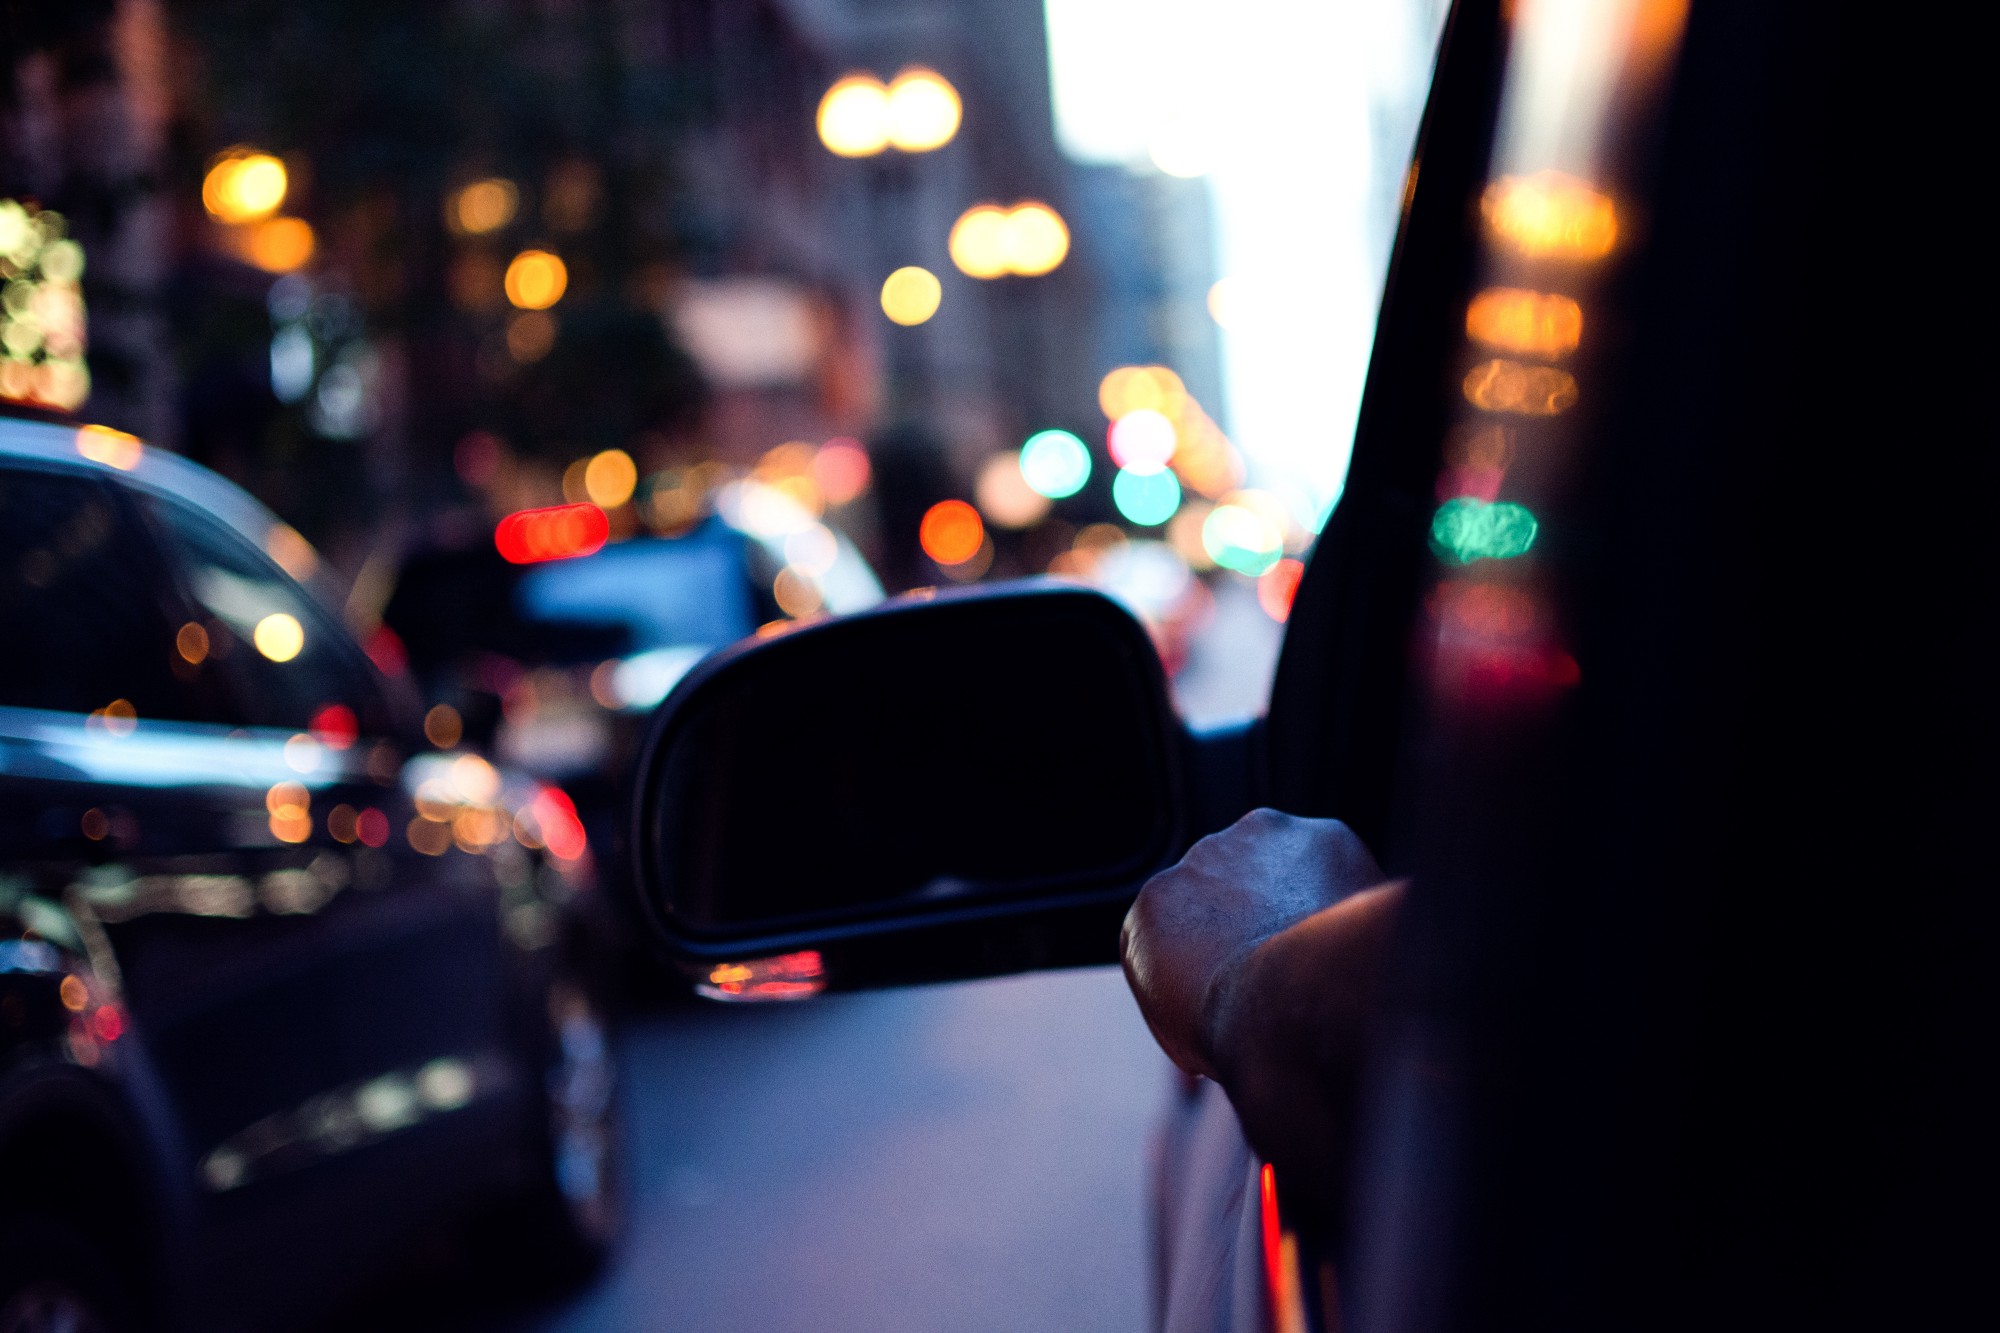
Driver’s Can Get Stuck In Their Ways…
Old habits die hard. Changing any driving behavior can prove difficult, and risky driving habits won’t disappear overnight. According to one study, about 87 percent of drivers have engaged in at least one risky driving behavior incident within the past month. Aggressive driving and texting while driving are examples of common unsafe driving behaviors that put us all at risk. Nonetheless, knowledge is power. Gaining insight into driver behavior can help streamline the time and effort spent trying to correct risky driving behaviors. A couple of recent studies have broken down how we behave behind the wheel, revealing interesting insights that can potentially help us become better drivers.
What Does Driver Behavior Look Like Nationally?
On average, drivers across the United States used their phones on more than a third of their trips. The finding was part of a recent survey which tracked driving behavior displayed by thousands of Americans over the course of 781 million miles.
To further break down this data, the average drive time for trips where phones are used is 29 minutes. Out of this 29 minutes, drivers spent more than three minutes on the phone. To put this in perspective, taking your eyes off the road to read a text for just five seconds at 55 mph is like driving more than the length of a football field blindfolded.
Age And Driver Behavior
When it comes to poor driving stereotypes, newly licensed teenagers get a bad rap. But the study shows that young adults actually aren’t as bad as we judge them to be. In fact, drivers age 17 and under were the most cautious drivers compared to the other age groups. They also surprisingly speed less than other age groups.
Gender And Driver Behavior
Women drivers were found to spend more time on their phones than men. Women use the phones on 42% of their trips on the road, compared to 38% of trips piloted by male drivers.Still, while women exhibited more tendency to talk, men channeled more aggressive driver behaviors, unfortunately.
According to the study, men were more susceptible to speeding which took place in 16% of their trips. This is higher than the 14% of women who do. Men are also guilty of making “hard turns,” which happens 12% of the time when behind the wheel. This again ranks a little higher compared to 10% of women behind the wheel.
Overall, however, the study notes the gender differences are small. Here, there’s not a big gender gap when it comes to safe driving. Overall, men and women had similar scores across all categories. Still, men and women both contributed to risky behavior behind the wheel. The biggest risk drivers of both genders take is speeding. Speeding took place in 38% of all trips with drivers breaking the speed limit for an average of 8% of their ride.
Phones were also reportedly used a collective 38% of the time, with drivers engaging with the device, on average, for about 3 minutes over the course of a ride. This comes out to about 11% of the trip’s total duration. And more so than gender, the location seemed to be the factor most indicative of bad behavior behind the wheel.
Driver Behavior And Geography
Most drivers probably have a few candidates in mind when they picture the worst drivers in the country. Let’s be honest, however. In New York, if you are a driver from out of state, you might get the label from native city drivers. Afterall, NYC drivers do have big egos behind the wheel.
But does the data back up this cockiness? Sorry, New Yorkers! According to the study, Midwesterners are the safest drivers and have the highest safe-driving ratings in the country. Drivers in the Northeast had some of the lowest scores. Nonetheless, five of the top 10 states with the worst drivers are in the South. These states tended to have the highest fatality rates and lowest auto insurance rates. So while it is perhaps fun to joke about the bad road etiquette of certain motorists, bad accidents, and negligent driving are no laughing matter.
Hyperlocal Study On Driver Behavior in NYC
Let look more geographically local. A group of New York University graduate students found that the computerized data from most cars on New York City streets which tracks information like hard-braking and sharp speed increases could offer a better understanding of driver behavior and add another layer of insight into identifying dangerous streets ripe for improvements.
Goals Of The NYU Report On Driver Behavior
The students analyzed data the collected by a smart-ride app company called Dash
from the computer systems in 281 vehicles over a six-month period. The Capstone team aimed to answer three main questions: First, how are drivers behaving when they move through NYC? Next, how does the urban environment affect a driver’s behavior? Lastly, they seek to find the potential use of this type of data in the future, when telematics platforms are more generalized and automated vehicles or connected cars permeate society?
While the scope of the report is too small to produce conclusive findings, it nonetheless brings value. The report helped map out speeding based on time of day, weather, posted speed limits and location. This can be useful down the road in coming up with solutions to problem areas around the city.
Where Do Driver’s Behave the Worst In NYC?
Speeding was most often identified on New York’s major thoroughfares. Highways like the Henry Hudson Parkway along Manhattan’s Upper West Side and Brooklyn Queens Expressway were big problem spots among others.
The report also calls into questions the efficacy of speed bumps. The report finds that drivers tended to quickly speed up immediately after passing over humps. Compared to nearby streets without them, mean, median and maximum speeds were similar, according to the report. Finally, the report shows that parts of lower Manhattan, midtown, and Brooklyn Heights were highlighted for hard braking. This could be used to identify “near-miss” collisions,
The Report’s Takeaways
Tracking all the private vehicles in the city raises obvious privacy concerns. This problem is something that must be addressed of course. Nonetheless, data can provide a treasure trove of information we can use to improve safety behind the wheel for all drivers.
The city is trying to take advantage of this. New York City oversees a fleet of 30,000 municipal vehicles and there are another 130,000 vehicles licensed by the city’s Taxi and Limousine Commission. In the city’s Vision Zero Year Three report, published early last year, the de Blasio administration outlined an initiative to track the city’s municipal fleet with similar technology to “gain an unprecedented amount of information about driver behavior.”
While it’s unclear how much progress has been made on this front, a DOT spokesman said the program is still in development and that the city plans to use the data for safety, planning and research purposes.
Do you think data can be useful in figuring out how to drive safer behind the wheel? How can we use data to improve safety in your opinion? Let us know in the comments below!